Build engaging data stories
No need for coding expertise to:
- Visualize insights
- Create maps
- Add unique narratives
- Share data stories that are easy to understand

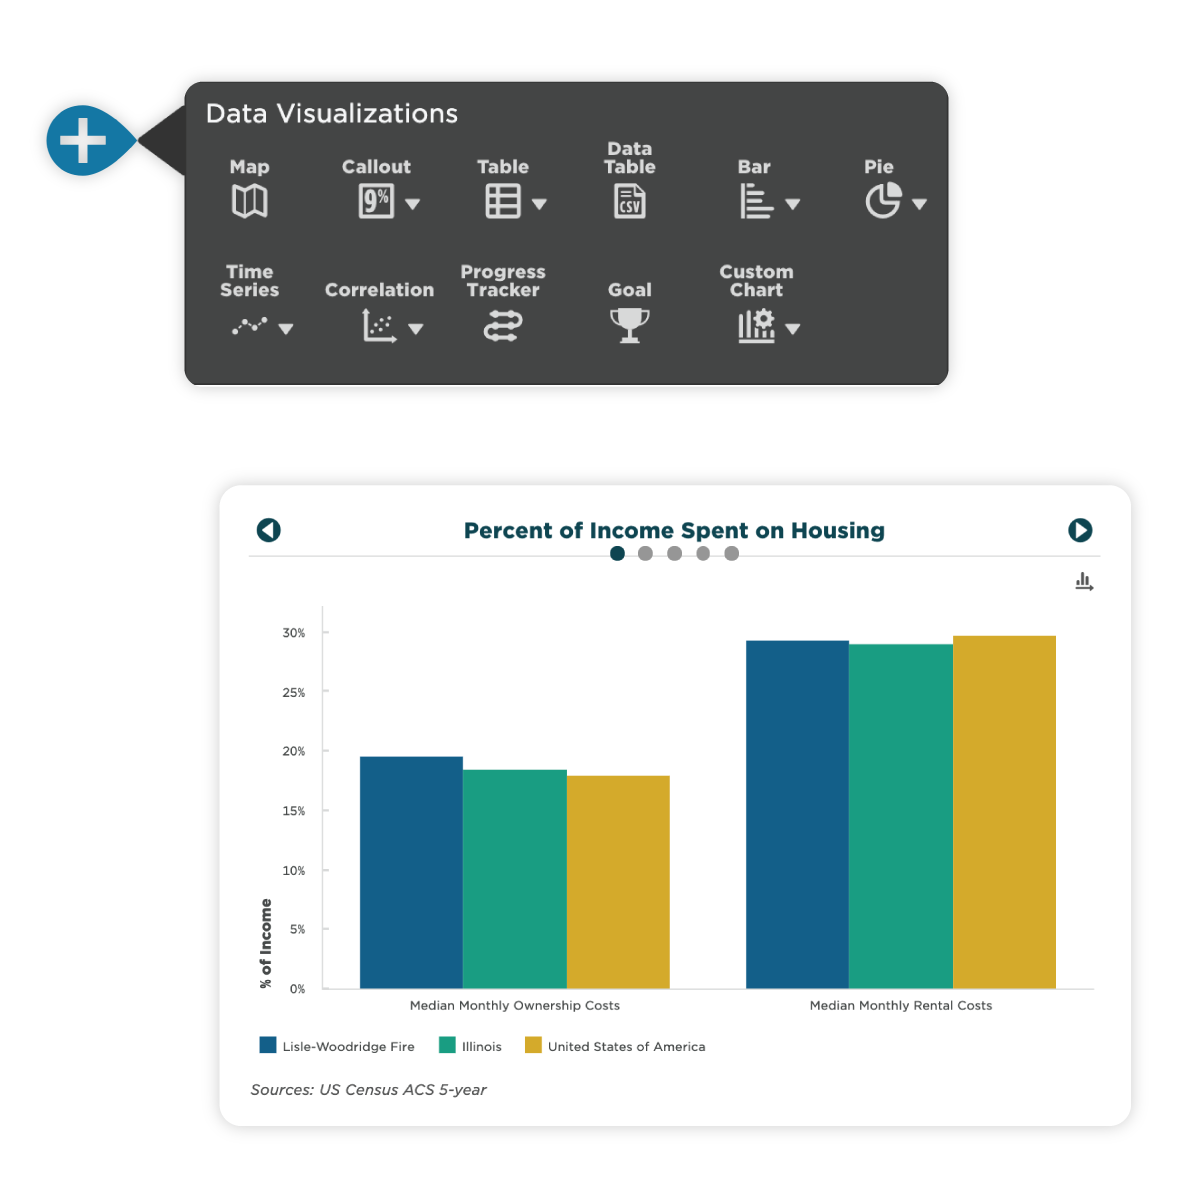
Bring community data to life with visualizations
In just a few clicks you'll unlock insights about the places that matter to you most.
-
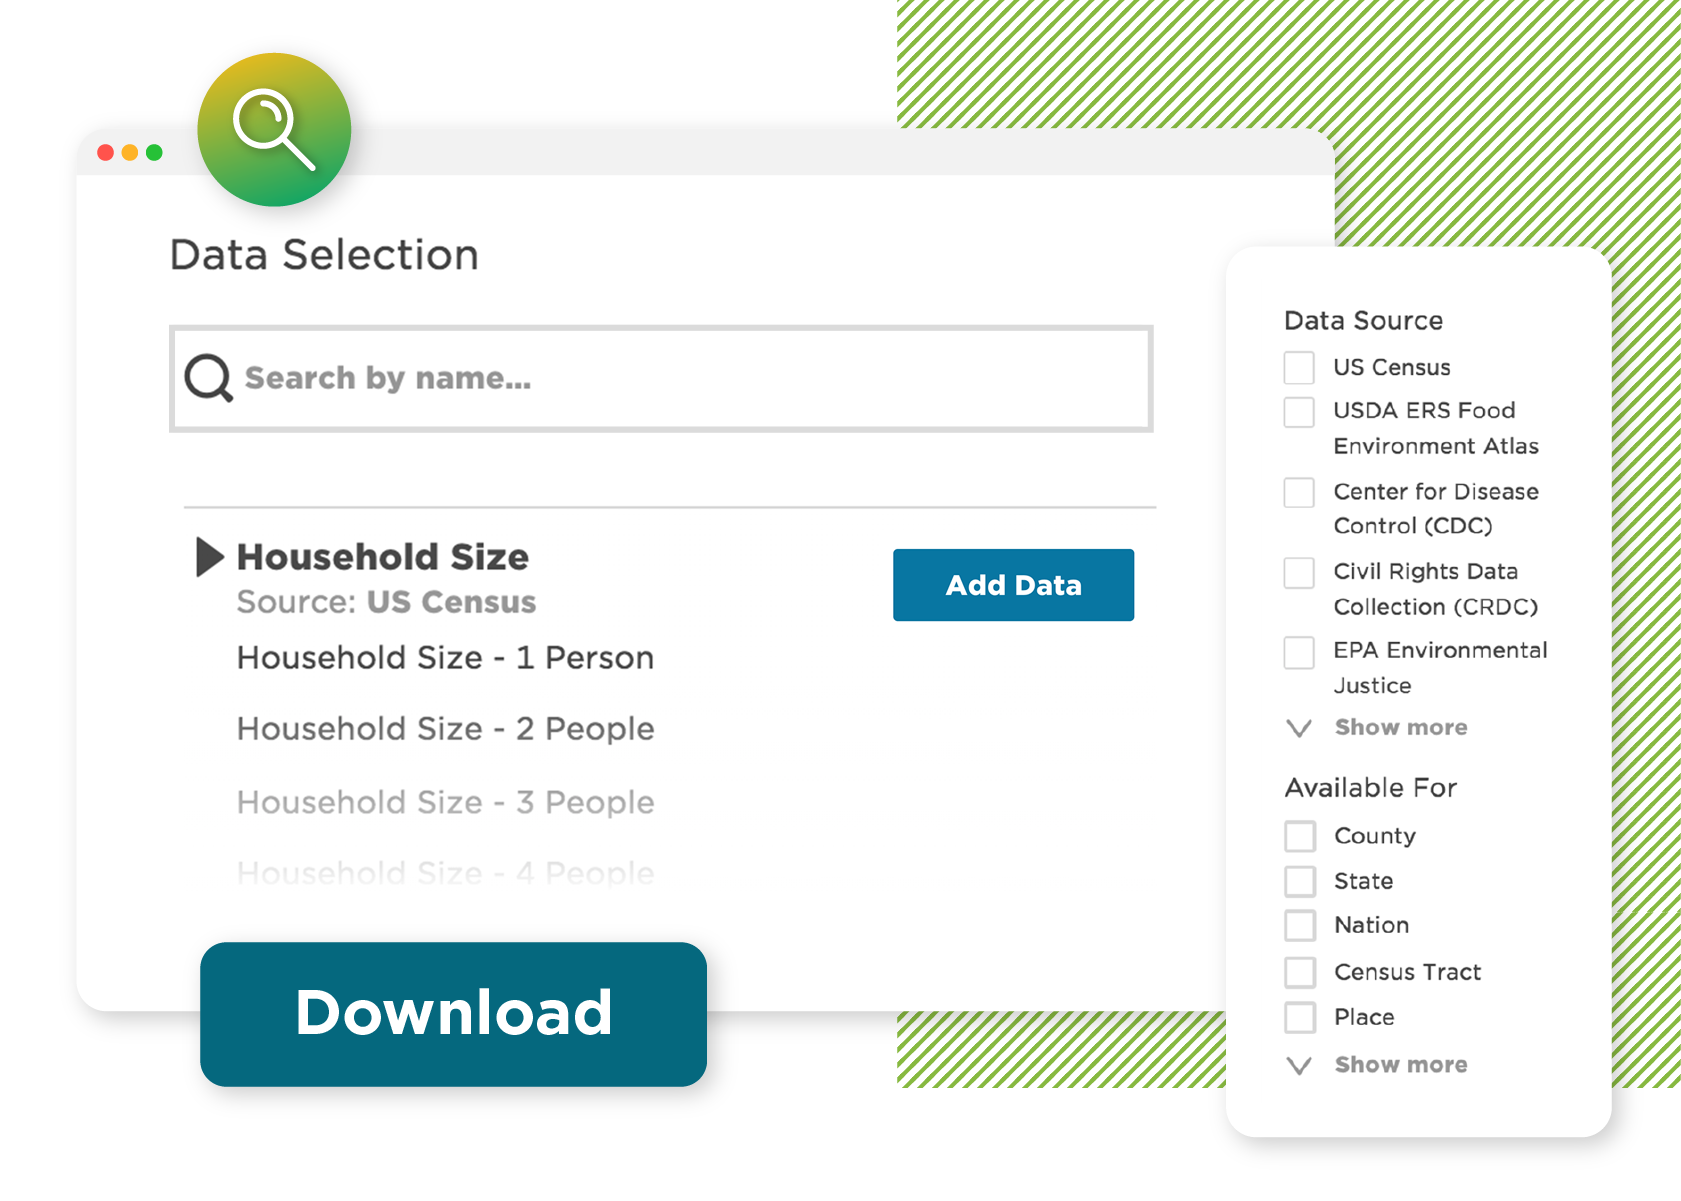
Pull from 40+ sources & 4+ billion data points to create maps, charts, correlations, and more visualizations.
-
Easily analyze data relationships with tools like time series and bivariate maps.
- Add context, media, and narratives that reflect the unique aspects of your community and initiatives.
Start from best practice with helpful templates
Curated by data and industry experts, build stories from report and dashboard templates about topics communities care about most.
- Start building data stories with pre-loaded data and insights.
- Leverage solutions backed by industry standards and used by communities across the country.
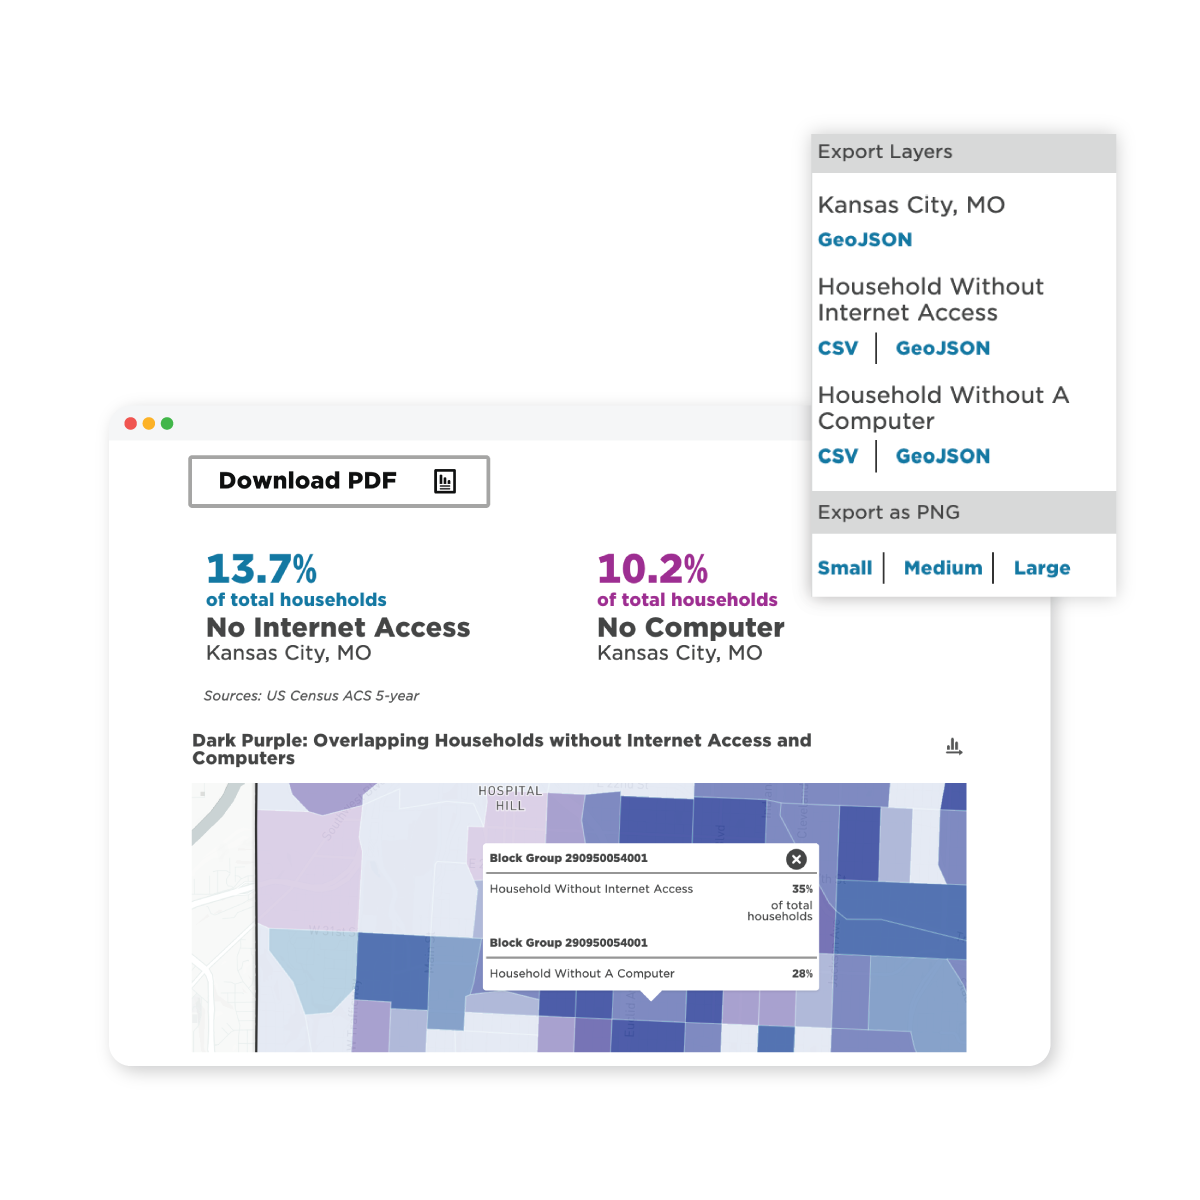
Build trust through transparency
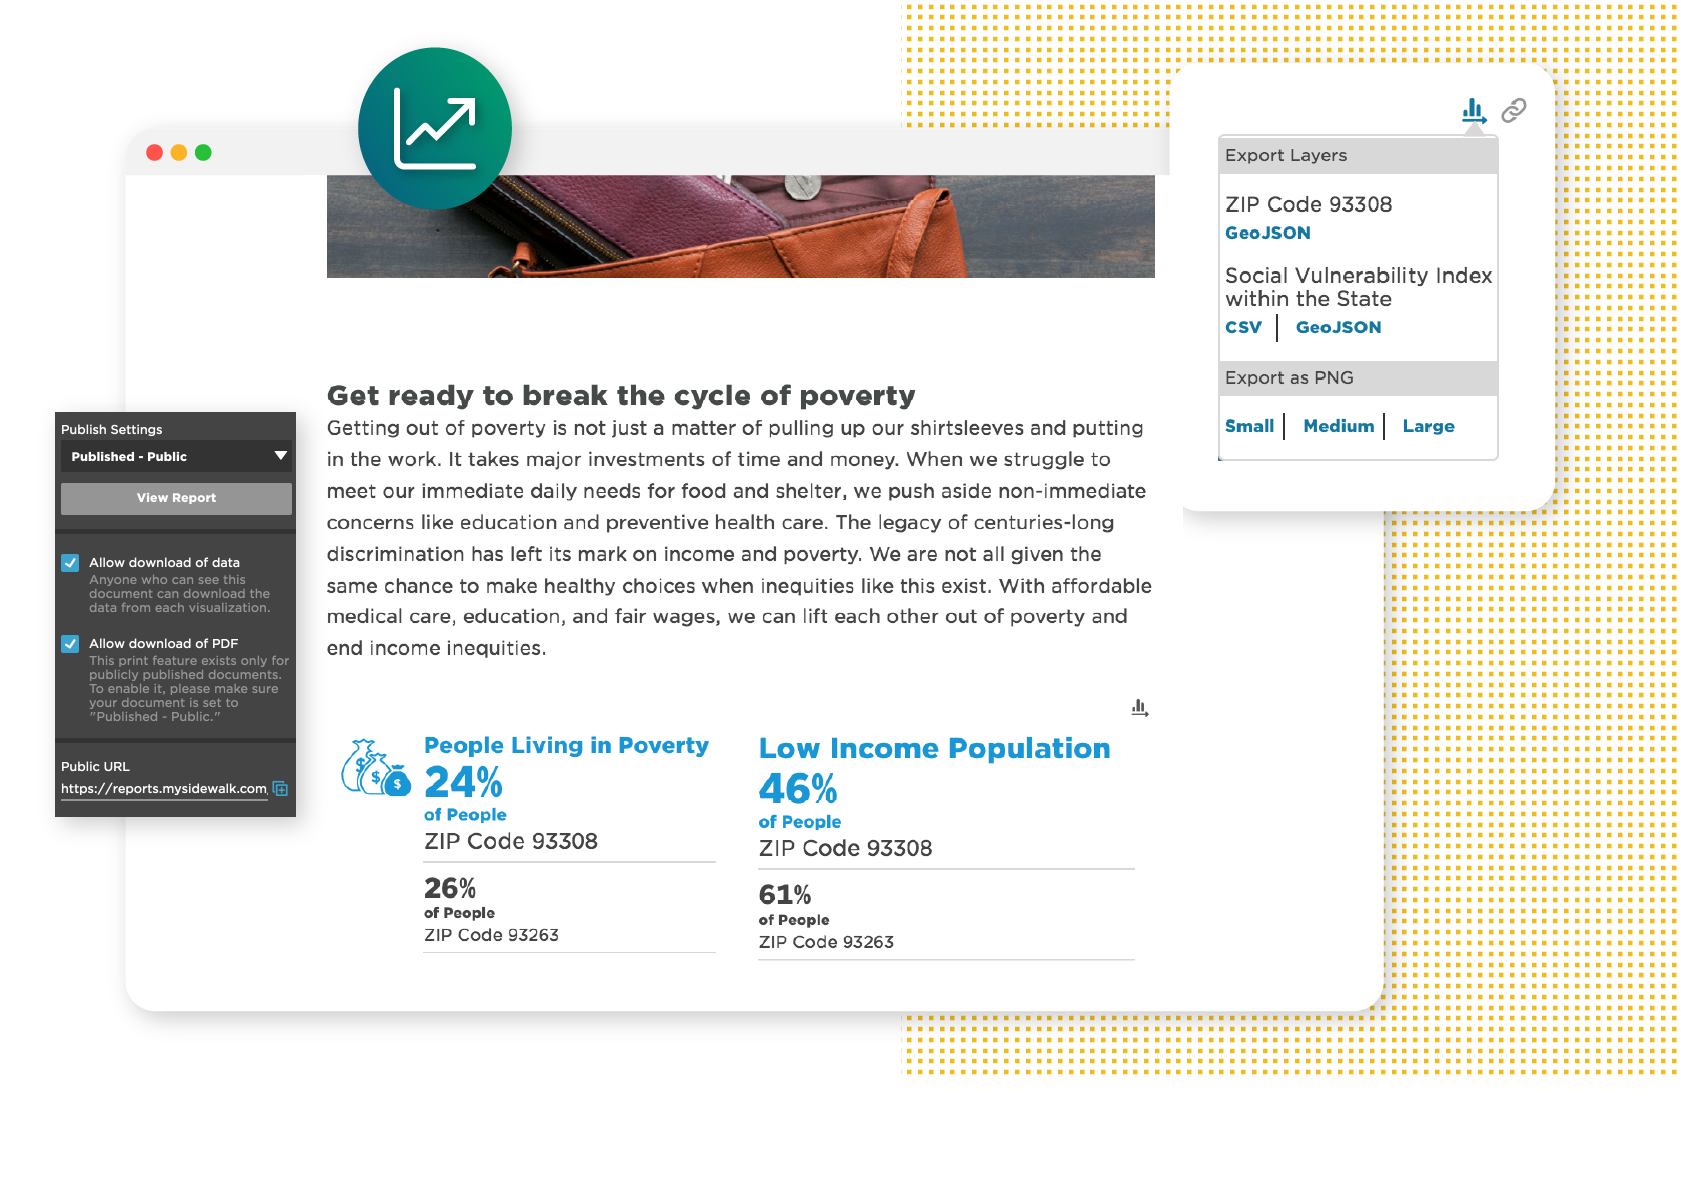
Make publishing data practical and straightforward with one-click sharing to your team, organization, stakeholders, or the public.
-
Quickly publish and embed data stories into URLs, PDFs, images, and data export options.
-
Communicate updates and progress that add context and connect data to community goals in multiple formats.
.gif "Introducing unlimited dashboards. Zero limitations. Countless data stories.")


Make a difference with mySidewalk.
Learn about our products.
It starts with our data philosophy.
Browse our solutions.
What our customers are saying about Chart.