
Exhibit
Defined Terms - General
“Data Indicator” means a single observation for the geographic subjects of interest. It represents the measurement of a single concept at a single point in time/currency. It may be a label (nominal/categorical) or numerical (ordinal/interval) value. This term is synonymous with a “value”, “feature”, “attribute”, or “column”.
“Dataset” means a collection of Data Indicators from a single source entity, digital location, topic/theme, table, and download/retrieval action. For example, the 311 response and closure performance data from an open data portal or the aggregated BRFSS (Behavioral Risk Factor Surveillance System) survey results for FL counties, 2016.
“Design template” is the template created by mySidewalk for the selected solution. Dashboard templates are created as best in class solutions in conjunction with feedback from our customer base.
“Visualization” is the selected choice for viewing selected data indicators. Unless otherwise specified by the solution, visualization choices are pre-determined and in alignment with the dashboard design template.
“Copy” is the best-in-class narrative choices provided by mySidewalk to the Customer. Unless otherwise specified by the solution, narrative choices are pre-determined and in alignment with the dashboard design template.
“Photo” is the selected choice for visuals to supplement copy. Unless otherwise specified by the solution, photo choices are pre-determined and in alignment with the dashboard design template.
“Update” is the defined term (i.e. monthly, quarterly, annually) of the dashboard update. Updates are refreshes to the indicators and visualizations originally signed off on at time of delivery. Additions or edits of indicators or visualizations at time of update may incur additional costs.
Exclusions & Constraints
If included in the Scope of Work, mySidewalk will:
-
Download public and immediately available data from an online portal; however, mySidewalk will not make data requests on behalf of the Customer.
-
Integrate with an API or data portal.
-
Aggregate and apportion parcel-level or other fine-grain data to a larger geography.
-
Aggregate and transform transactional data into analytical data.
-
Geocode and/or georeference data to geographic subjects.
-
Support user data integration through:
-
Manual input via custom charts, including line, bar, and pie charts, and callouts.
-
Auto-upload data within a defined geography. Each layer must contain less than 5,000 features and be less than 50MB in size. Multiple layers can be uploaded at a time by adding them to a zip archive. Shapefiles and Esri geodatabases are required to be zipped since they contain multiple files.
-
Supported file types include:
-
Esri Shapefile
-
Esri File Geodatabase (.gdb)
-
Esri Personal Geodatabase (.mdb)
-
KML
-
GML
-
SQLite Database
-
GeoJSON
-
CSV
If during the performance of the Scope of Work, a request or recommendation for the preceding operations is made that is not explicitly included in the Scope of Work, mySidewalk will prepare an estimate of the additional cost and an addendum of the additional work to this Scope of Work for the Customer to approve.
ADA Accessibility
mySidewalk Inc. is committed to ensuring digital accessibility for people with disabilities. Our Shared Documents, including Reports, Dashboards, and Embeddable Assets all in their shared, reading friendly format, have been engineered for accessibility to the widest possible audience. We are continually improving the user experience for everyone, and applying relevant accessibility standards.
Measures To Support Accessibility
mySidewalk Inc. takes the following measures to ensure accessibility of mySidewalk Shared Documents:
-
Provide continual accessibility training for our staff.
-
Assign clear accessibility targets and responsibilities.
-
Employ formal accessibility quality assurance methods.
-
Communicating the results of accessibility audits and evaluations for transparency.
Conformance Status
The Web Content Accessibility Guidelines (WCAG) define requirements for designers and developers to improve accessibility for people with disabilities. They define three levels of conformance: Level A, Level AA, and Level AAA. When using accessible default color palettes and semantically correct elements, mySidewalk Shared Documents conform fully with WCAG 2.0 level AA. Conforming fully means that the content fully conforms to the accessibility standard without any failed criteria.
Fire Performance methodology
-
mySidewalk uses the full spreadsheet of incident data provided by the Customer for final calculations and assumes the data provided is complete and accurate.
-
Missing timestamp data entries are represented as null values and removed from analysis
-
Data entries with timestamps outside the 5-year timeframe are removed from analysis
-
Data entries without a Call Type or Incident Type are removed from analysis
-
-
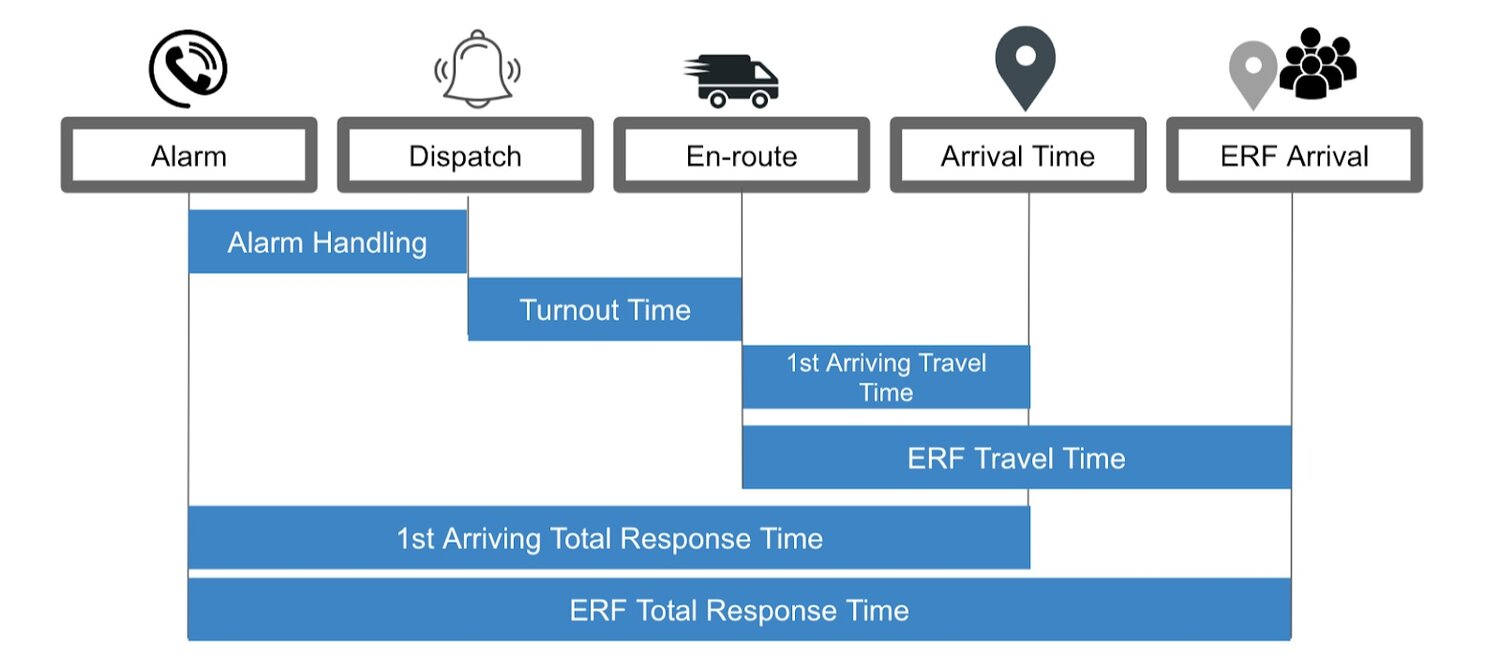
Response time categories are calculated for: Alarm Handling, Turnout Time, First Arriving Travel Time, Effective Response Force (ERF) Travel Time, First Arriving Total Time, and ERF Total Time.
-
mySidewalk calculates the Effective Response Force based on the input from the Customer. The ERF Travel Time begins when the first unit is en-route and ends when the last unit needed for the effective response force arrives on scene.
-
Response times will be calculated at the 90th percentile and will use Definition Two of the CPSE-approved 90th percentile calculation methodologies:
-
“The highest value in the lowest X percent of the data. In the case of the data set of 100, the 90th percentile would be the highest value in the lowest 90 percent of the data, so it would be the 90th value when sorted in rank order. In a data set of 10, it would be the ninth value.” -Community Risk Assessment Standards of Cover 6th Edition
-
-
mySidewalk does not display any calculation of response times as an average.
-
Outliers will be removed using the following treatment:
-
Calculating the standard deviation and mean of the response times for each month
-
Calculating a high cutoff that is the sum of the mean response time and 3 standard deviations of the response times (i.e. [mean response time] + 3 * [response time standard deviation]) for each month and a low cutoff that is the difference of the mean response time and 3 standard deviations of the response times (i.e. [mean response time] - 3 * [response time standard deviation]) for each month
-
Marking incidents with response times higher than the high cutoff and lower than the low cutoff as outliers and removing them from all further calculations involving response times
-
We are able to further sub-segment outlier treatment (beyond month, i.e. incident category, risk level, etc.) at an additional charge
-
When calculated in this manner, the total number of outliers is not affected by how they are subset
Fire Performance component schedule
-
| Page | Component | Visualization | Geography |
|---|---|---|---|
| Incident Report | 1 Month Total incident count | Callout | Department-wide |
| 1 Month Incident count by type | Table | Department-wide | |
| Last 5 Years (January-December) incidents by year by month | Line Chart | Department-wide | |
| Last 5 Years YTD Incidents by Type | Stacked Bar Chart | Department-wide | |
| Last 5 Years YTD Incidents by Station | Stacked Bar Chart | Department-wide | |
| Last 5 Years YTD Incidents by Emergency vs. Non-Emergency | Stacked Bar Chart | Department-wide | |
| YTD Total Incidents by planning zone with YTD Incident type breakout filters | Map | Department-wide | |
| YOY YTD % Change in Incidents by planning zone with previous 5-year YTD total incident filter | Map | Department-wide | |
| YTD Total Incidents by Apparatus | Bar Chart | Department-wide | |
| Response Report | 1 Month 90th Percentile Total Response Time | Callout | Department-wide |
| 1 Month 90th Percentile Time element breakdown (Alarm handling, turnout time, first arriving travel time, effective response force travel time) | Table | Department-wide | |
| Last 5 Years (January-December) 90th Percentile First Arriving Total TIme and ERF Total Time by year by month | Stacked Line Chart | Department-wide | |
| Last 5 Years YTD 90th Percentile Time element (Alarm handling, turnout time, first arriving travel time, first arriving total time, effective response force travel time, effective response total time) breakdown | Stacked Bar Chart | Department-wide | |
| Last 5 Years YTD 90th Percentile Time element (Alarm handling, turnout time, first arriving travel time, first arriving total time, effective response force travel time, effective response total time) by type | Stacked Bar Chart | Department-wide | |
| Last 5 Years YTD 90th Percentile Turnout Time by station | Stacked Bar Chart | Department-wide | |
| Last 5 Years YTD 90th Percentile first arriving Travel Time by station | Stacked Bar Chart | Department-wide | |
| Last 5 Years YTD 90th Percentile Emergency vs. Non-emergency Total Time | Stacked Bar Chart | Department-wide | |
| YTD 90th Percentile Total Response Time by Planning Zone with Last 5 Years YTD Total Response Time Filters | Map | Department-wide | |
| YOY % Change 90th Percentile Total Response Time by Planning Zone with Last 5 Years YTD effective response force Total Time Filters | Map | Department-wide | |
| YTD 90th Percentile Turnout Time by Apparatus/Shift | Bar Chart | Department-wide | |
| Goals Report | 1 Month % of all goals met | Callout | Department-wide |
| 1 Month % of Alarm Handling, Turnout time, first arriving travel time, first arriving total time, effective response force travel time, effective response force total time goals met | Table | Department-wide | |
| Last 5 Years (January-December) % of all Goals Met by Year by Month | Stacked Line Chart | Department-wide | |
| Last 5 Years YTD % Alarm Handling, Turnout Time, first arriving travel time, first arriving total time, effective response force travel time, effective response force total time goals met | Stacked Bar Chart | Department-wide | |
| Last 5 Years YTD % Alarm Handling, Turnout Time, first arriving travel time, first arriving total time, effective response force travel time, effective response force total time goals met by type | Stacked Bar Chart | Department-wide | |
| Last 5 Years YTD % of total goals Met by Station | Stacked Bar Chart | Department-wide | |
| YTD 90th Percentile Total Response Time by Planning Zone with Last 5 Years YTD Total Response Time Filters | Map | Department-wide | |
| YTD % Goals Met by Shift/Apparatus | Bar Chart | Department-wide | |
| Station Report | 1 Month Total incident count | Callout | individual station |
| 1 Month Incident count by type | Table | Individual station | |
| Last 5 years total incidents by month | Line Chart | Individual station | |
| YTD Incidents by Planning Zone with incident type filters | Map | Individual station | |
| 1 Month 90th Percentile Total Response Time | Callout | Individual station | |
| 1 Month 90th Percentile time element breakdown (Turnout time, first arriving travel time, first arriving total response time) | Table | Individual station | |
| 1 Month 90th Percentile Turnout Time by Shift/Apparatus | Bar Chart | Individual station | |
| Last 5 Years 90th Percentile time element breakdown (Turnout time, first arriving travel time, first arriving total response time) | Line Chart | Individual station | |
| Last 5 Years 90th Percentile time element breakdown (Turnout time, first arriving travel time, first arriving total response time) by type | Line Chart | Individual station |