

Our customers care about their communities, and so do we. Community leaders—from hardworking staff to elected officials—rely on equity data to make critical decisions on a wide range of topics. Presently, it is unclear whether this data will continue to be released, how frequently, or in what form. Truthfully, nowhere is this uncertainty more acute than equity and climate resilience data.
The reality is that finding good, up-to-date equity data has always been a challenge. Some data sources, like the CDC, have only released equity data biennially. Some only release data for a few geography types, like Census Tracts and Counties. And others don’t include some of the most relevant indicators.
At a time when government agencies' continued provision of data is all but certain, and as uncertainty threatens the resiliency of communities, mySidewalk is stepping up to the plate. We are doing what we can to reaffirm our commitment to preserving your access to this mission-critical data.
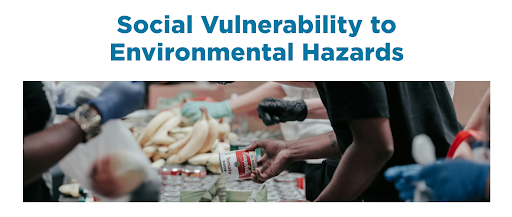
Meet the New and Improved Social Vulnerability Index
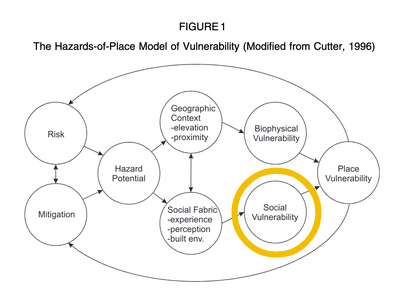
Social Vulnerability is the ultimate equity indicator. It answers the question: when times are the toughest, who is most at risk? Specifically, Social Vulnerability Indices identify parts of our communities that will have the toughest time experiencing and recovering from environmental hazards.
One of the great ironies of the present moment is that many are losing access to critical data when they need it most. Catastrophic environmental events continue to increase in frequency and severity. These events include everything from hurricanes and wildfires to dangerous heat waves and winter storms. Whatever the event, we know that the most vulnerable in our communities will be impacted the most.
Social Vulnerability Indices are complex. They require a lot of data and advanced statistical methods to create. For this reason, data sources don’t update them all that often. Furthermore, they frequently aren’t available at important geographic levels. For example, the most recent SoVI published by the University of South Carolina’s Hazard Vulnerability and Resilience Institute (USC HVRI) uses 2019 ACS data and is only available at the county level.
We know that our users need more recent data and more granular geographies than what is currently available. This is essential to telling timely, compelling data stories, and it’s also critical for effective disaster preparedness planning.
mySidewalk has adapted pioneering social vulnerability research developed by the USC HVRI to create an up-to-date and broadly accessible Social Vulnerability Index (SoVI).

Our efforts have allowed us to update the SoVI to the most recent ACS data (2023, released in December 2024), and expand the number of available geographies to eleven. This means we are now offering data that is at least one year newer than anyone else, and for at least eight more geographies than anyone else.
Additionally, we have implemented methodological improvements which have resulted in a more balanced representation of each input in the index, leading to a better and more consistent index overall. We believe—and statistical testing has confirmed—that mySidewalk’s version of this index is better than ever before at identifying the most socially vulnerable segments of our communities.
Let’s talk briefly about future updates to this Index. In a “business-as-usual” climate, users should expect our Index to update annually. All of the inputs for the Index are derived from US Census American Community Survey (ACS) data. In December 2024, 2019-2023 5-Year ACS data was available in mySidewalk’s data library three days after it was published by the Census Bureau. This means that in future years, users should expect new SoVI data shortly following our annual ACS update. Should the ACS ever fail to update, we are uniquely well-positioned as a company to handle that contingency.
Getting Started with SoVI
If you are not familiar with SoVI yet, we’ve taken steps to make it easy for you to get started. First, you can read about how we built this index in our Help Article, or in the SoVI catalog page. We have also created a new report template, which you can find in our template library, and a Seek Guide. [Links to come]
Historically, this Index has been valuable in disaster preparedness and recovery efforts. State, County, and City planners have leveraged SoVI in their Disaster Impact Assessments, Disaster Recovery Action Plans, and local Hazard Mitigation Plans. But SoVI is more than just an index of “disaster risk.”
As you can see in the catalog page, this Index doesn’t actually include any environmental data. SoVI was created specifically to address the social dimension of hazard vulnerability. The upshot of this is that you shouldn’t feel restricted to only using the Index when discussing disaster preparedness or recovery.
Cutter, Susan L., Bryan J. Boruff, and W. Lynn Shirley. "Social Vulnerability to Environmental Hazards." Social Science Quarterly, vol. 84, no. 2, 2003, pp. 242-261.
In any instance where you want to summarize equity gaps in your community, SoVI is an excellent place to start. In this way, for example, this index is as much about Social Determinants of Health (SDoH) as it is environmental hazards.
A Note from the Author
I want to wrap things up here by addressing the moment. On the day when I wrote this blog, the CDC removed their Social Vulnerability Index from their website. It is unclear when or if it will return, but I hope that it does. In the meantime, mySidewalk is here to help. We remain as committed as ever to ensuring that you have the best possible data to make the kinds of smart, informed decisions that our communities desperately need. Rest assured that our team will continue to find ways to fill in the gaps as they arise.
Share this
Assessing Economic Vulnerability in the Greater KC Metro
Housing and Economic Vulnerability in the Greater Nashville Metro

No Comments Yet
Let us know what you think