Trusting Your Data: How to Build a System for Success
Your data source is only the beginning when it comes to confidence in community data and the decisions that follow.
Effective data storage and management makes data easy to use and becomes a living system that helps find and correct errors--building trust and reliability in the insight it unlocks.
With how much we read data in headlines and social media, it can be easy to assume decisions that impact communities are always informed and guided by the best information possible. Analysts and experts can get the data they need. Officials and public servants have the tools needed to make sense of it. Changemakers can communicate their impact.
Ideal...but not always the case. Data portals and gov websites are often hard to navigate and make data exploration more like a chore than, well...exploring, and you're often only accessing a piece of the picture. Even once you get the data you need, it is only the beginning of the work. There are more questions to be asked: How was this collected or calculated? What is (or is not) represented in this data? Are these data values accurate?
To answer these questions, you need to look toward the ongoing maintenance of your data system.
Trusting Your Data System
Data validation and ongoing maintenance are necessary to create and sustain confidence in your data and the insights you find. A system to identify and correct flaws is essential to healthy data.
Though data can get complex, we believe it's important to continue making data easier to find, work with, and share. But how do you effectively and efficiently trust all the data you need when you don't know where to start, or just don't have the time?
From our experience and our collaborations with partners, we know a comprehensive data environment is foundational for building confidence in data. When gauging trust in data, ask yourself:
- What information do I have about my data? Knowing information about your data such as how it was collected, when, context, limitations, and more.
- How (and how often) do I verify my data? Routine review, validation, and updating of data is important to the continued flow of insight and intelligence to people and decisions. Software and calculation errors, out-of-date information, and human mistakes are just a few of the challenges that can occur at any point.
- How connected is my data? Data silos keep information apart, and you need comprehensive information. At the same time--not all data is meant to be connected. Understanding and maintaining data relationships can keep you from missing the bigger picture.
Is this really all important? Data mistakes don’t just provide incorrect information. At their worst, data errors cause people to lose trust in all presented information. No person or data is immune to flaws, and even the most trustworthy of sources should be checked and validated.
Earlier this year, we ran into this issue with values from the United States Department of Agriculture (USDA).
Case Study: Avoiding a Data Disaster
Whether human or machine, mistakes and errors will happen--but they can be planned for.
Data helps answer questions such as: How do food choices and availability impact my community's health and diet? To provide information on community food access, the USDA's Economic Research Service (ERS) publishes the Food Environment Atlas. Data from the Atlas included in mySidewalk's Data Library, and our internal data process detected flaws in how some data values were calculated.
In a nutshell, important information straight from the source was wrong. To understand how we fixed it, we turn to the experts that manage mySidewalk's Data Library.
 Data Deep-Dive Data Deep-Dive |
|
What made the data wrong? How did you fix it? We were able to make these corrections because the mySidewalk data system is built around geography and maintains metadata about every value. The mySidewalk data system made it easy for the team to pull the needed values for over 3,000 geographies to serve as the correct denominators, fixing over 70,000 precalculated percentages, and update all existing data visualizations with the corrected values. |
Creating An Efficient Data Process
An organized, clean, and accessible data system is a must-have for driving data-driven decisions with accuracy. Data isn't magic--there's a lot under the hood--but you don't have to be an advanced data scientist to get it right. Thanks to our data process, we were able to correct the issue and update over 70k values, preserving data stories in our partner's communities.
- Our Data Library contains information from over 40 data sources, each with rich metadata describing: time, geography, labels, relationships with other data, units, format, availability, and source information.
- Every data source is regularly checked for updates, and variables receive routine review, with new variables and data sources routinely added.
- By storing information about each data variable in multiple ways, we can easily match things, such as time, variable, and geography to validate and connect information for easier analysis and communication.
Of course--data alone isn't a path to success, both in process and real world impact. Even good data isn't helpful to anyone if nobody knows it's there.
Data In Action: Solving Community Problems
By quickly correcting the USDA data values, real world stories of food landscapes and access can be told with accuracy and stay focused on building impact.
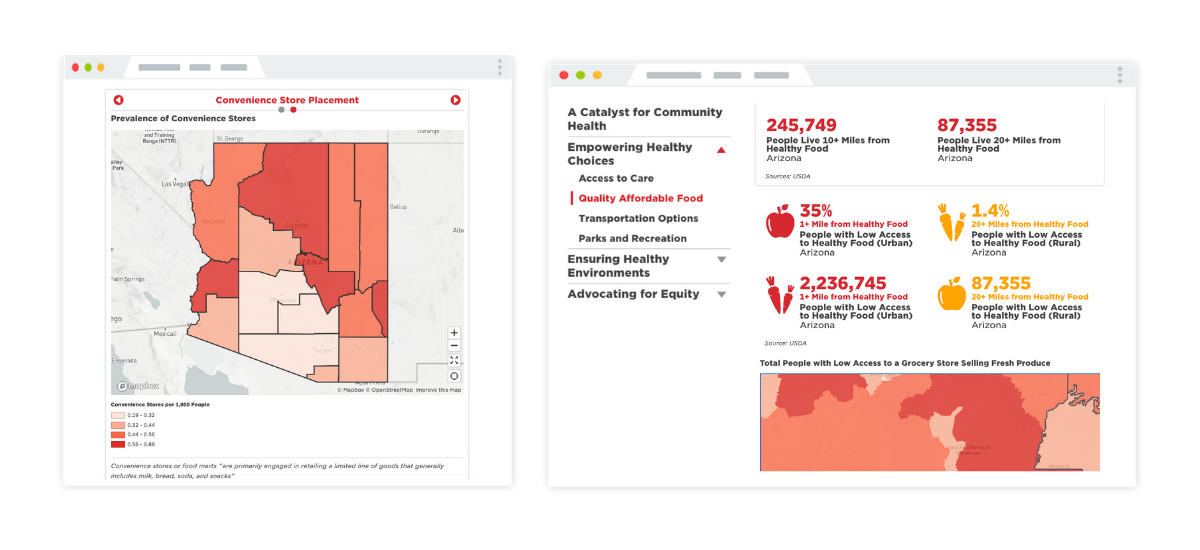
 Statewide Health Data Dashboard - Vitalyst Health
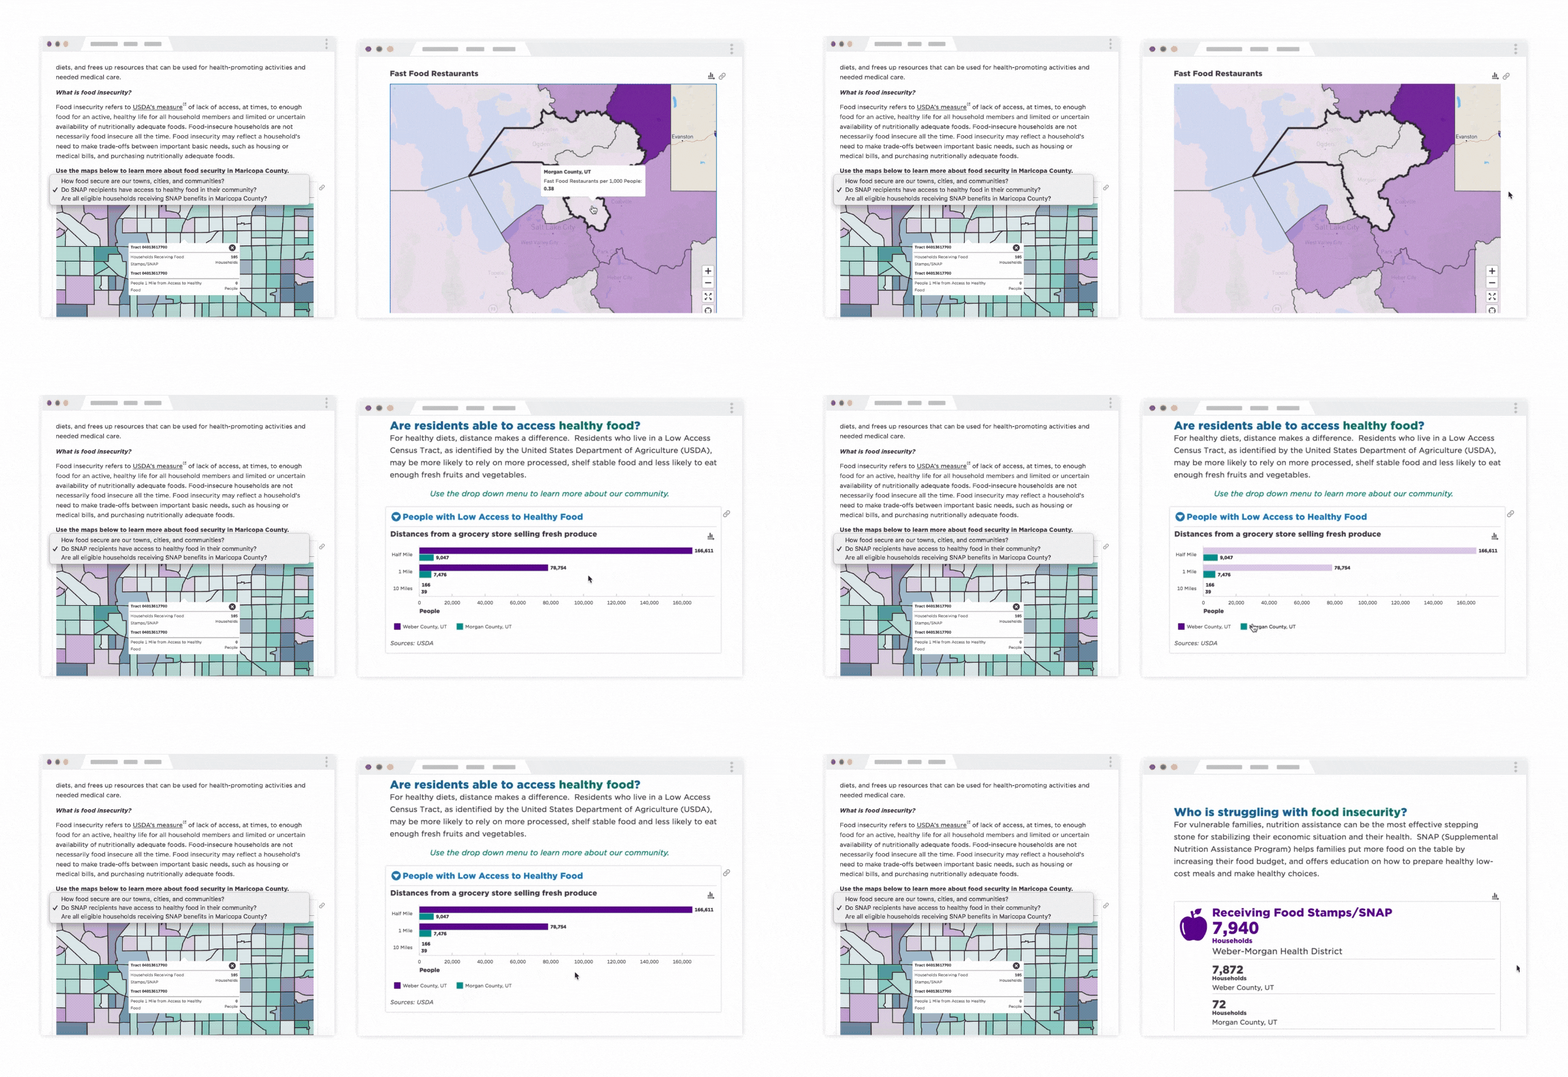
It is the work done by organizations like Weber-Morgan Health Department, Maricopa County Department of Public Health, and Vitalyst Health Foundation that uses data to push forward change. In this instance: using information from the USDA to share visualizations and narratives about community food conditions to the public. By publishing with mySidewalk, they can rest assured that the information displayed is clear for their audience and that the data is extensively and continuously reviewed.
Whether it's validating and updating data or helping craft a communications strategy, we're honored to have just a part of improving communities across the country.
 SNAP Usage in Maricopa County & Weber-Morgan Health Department CHA
Access A Data System Built on Reliability
Building and maintaining a data system requires time and expertise, but data access shouldn't have to. We launched Seek last month as the next step in our mission to democratize data. Seek allows you to browse, select, and download data from the mySidewalk Data Library, which is validated and maintained with the principles above and is what power data stories used by changemakers across the country.
Existing mySidewalk Platform subscriber?
Start using Seek or take a tour now.
Share this
You May Also Like
These Related Stories

Download, Map, & Share New ACS 5-Year Estimates
Sidewalk Session Snapshot: A Gathering Place for Data-Driven Changemakers

.gif?width=748&name=Introducing%20Seek.%20(2).gif)
No Comments Yet
Let us know what you think