Assessing Economic Vulnerability in the Greater KC Metro
Economic vulnerability arises from the interplay of many factors. Understanding how these factors interplay, and how to target policy, programs, and solutions, is a challenge.
As a Data Storyteller with expertise in economic development, I know first hand that data science can help solve this challenge. An index is a sophisticated way to take complex conditions and distill them into a few simple numbers. For policymakers and stakeholders, this is a game-changer. Now, instead of trying to make sense of mountains of data, they can focus on creating impactful interventions.To help illustrate this, I applied our Economic Vulnerability Index (EVI) to our home metro area, Greater Kansas City, for analysis. The Greater Kansas City Metro Area consists of 9 counties and 119 communities. It’s one of the largest primarily bi-state regions in the country. Like all regions, the conditions that create economic vulnerability here are not unique in themselves. But through the analysis, some trends emerge. These trends also suggest some potential actions.
Patterns of Vulnerability
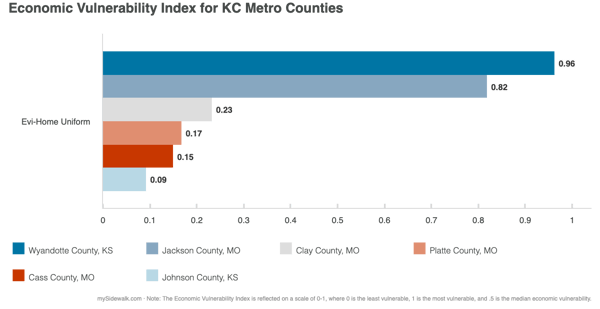
At the County level, what is most notable is the inconsistency between home and workplace vulnerability. The Kansas City region has long struggled to align residents with workplace locations. This phenomenon has deep roots in KC’s history. It’s a living artifact of mid-20th Century exclusionary housing policies and the growth policies after WWII.
Today, we see an environment where home and workplace vulnerability are roughly inverse. (A notable exception is Johnson County, KS, which has absorbed the majority of new development in the region for the past several decades). What this shows us is that in the Greater Kansas City Area, high home vulnerability means high workplace resilience. Put another way: local economic opportunities in high vulnerability areas don’t benefit residents.

.png?width=600&name=Economic%20Vulnerability%20Index%20for%20KC%20Metro%20Counties%20(Work%20Location).png)
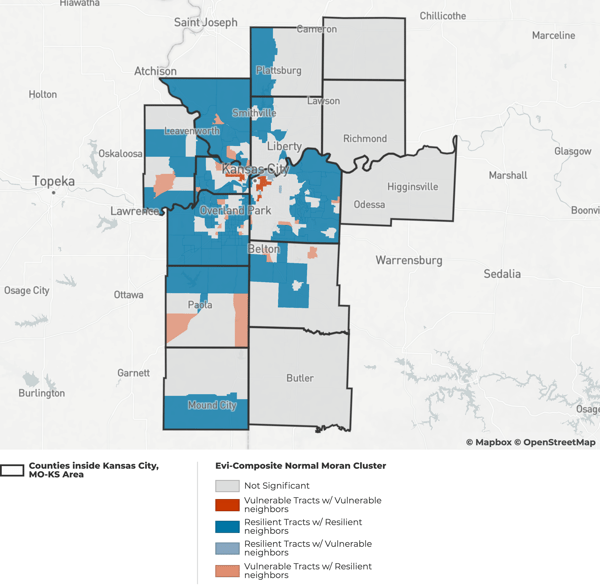
On a more local level, these trends manifest in familiar ways, as illustrated in the figure below:
- There is high vulnerability in historically disinvested communities in the urban core.
- Navigating out along the I-435 loop appears a bloc of resilience in affluent first-ring suburbs.
- Eastern KCMO and Downtown KCK are both predictably high vulnerability areas.
Looking at nearby resilient neighbors (shown in blue) can help inform interventions as well. What programs and policies are contributing to this neighborhood’s resilience? Can resources from these resilient areas support their vulnerable neighbors?
Suggested Actions
This analysis of economic vulnerability offers a few different interpretations. Depending on one’s ability to make interventions, the action they might take changes.
Economic Development Professionals
Part of what makes the Greater KC Metro economically vulnerable is the types and locations of available jobs. Manufacturing accounts for only 7% of the area’s total workforce, but that proportion doubles in islands of resilience. Conversely, COVID-19 has decimated construction jobs. Construction has similar education requirements as manufacturing, and is well-represented in vulnerable tracts. Economic cornerstones like “Eds and Meds” have not contributed resilience during this crisis. .
In contrast, transportation and warehousing industries have helped to create islands of resilience. These notes suggest a need to diversify the kinds of industries locating in the Greater KC Metro. Similarly, investments in jobs-training and entrepreneurial ecosystem support may also help.
Transportation Professionals
It might take decades to improve geographic alignment between jobs and residents. A more practical substitute would be improving the regional transit infrastructure. Cooperative, fully-regional funding mechanisms would be useful to address this mismatch. More targeted interventions could also improve conditions for residents. Things like Transportation Development Districts, ridesharing, microtransit, and on-demand services can help.
Housing and Community Development Professionals
Mass-transit options to connect vulnerable populations to resilient workplaces is are critical. More dense and affordable housing increases the feasibility of mass-transit options. Where applicable, revising development codes and policies to promote these conditions can help. Additionally, encouraging mixed-use development can achieve the same goal. This has the added benefit of attracting investment that creates local work opportunities.
Education Professionals
The jobs that most often appear in islands of resilience are typically accessible with lower levels of education. Those in industries like construction, manufacturing, and transportation/warehousing. For residents in these areas, this likely reflects what is currently available, not what is possible. “Eds and Meds” are prominent in high-vulnerability regions, and do not seem to contribute to resilience. Instead, there may be solutions worth exploring in improving the high-school-to-post-secondary-school pipeline.
Public Health Professionals
We know that economic and social inequality often results in unequal health outcomes. This analysis supports a need for continued cross-sector collaboration. Every crisis is an opportunity to rebuild stronger than we were before. And as the COVID-19 response conversation becomes a recovery conversation, this idea is crucial. It’s an opportunity to create a community of health and opportunity for everyone. The expertise of Public Health professionals has never been at a higher premium. Continued cross-sector guidance that considers public health impacts will lead the region forward.
Drew is a an economic development subject matter expert, and an experienced urban and transportation planner. Since joining the mySidewalk team in March, 2019, Drew has helped communities across the country develop a robust understanding of their local economies, and how they fit into - and can be competitive in - a global market. Drew holds a Masters in Urban and Regional Planning from the University of Colorado-Denver, and brings diverse professional experience to the table, including work in cities, counties, MPOs, and Community Benefit Organizations.
To learn more about the mySidewalk EVI and the results of the analysis, download the white paper here.
Share this
You May Also Like
These Related Stories
When Uncertainty Meets Resilience: How mySidewalk is Expanding and Protecting Access to Mission-Critical Data

Housing and Economic Vulnerability in the Greater Nashville Metro


No Comments Yet
Let us know what you think