9 Surprising Indicators of a Thriving Community
When I stepped into my office on day one as a local government Deputy Director, the first thing I did was ask for the latest Resident Insights (aka, a better way of saying Citizen Satisfaction) data from City Hall. I wanted to start this gig with a clear perspective on how our community viewed the work of my department, and establish some goals for success. My team included community engagement, marketing, and comms. We were to serve as the liaison to Council, the Mayor, and City Manager, so I wanted the best information possible to know if what we were doing was making a dent.
(Actually, I lied. The first thing I did was figure out where the vending machines were and whether they had Chili Cheese Fritos and Diet Coke. Data was the second thing.)
The results floored me. They weren’t bad--they weren’t anything. If there was a contest for which department had the most non-responses, we would have won hands down. The majority of respondents in this scientific, randomized survey claimed they “didn’t use” the Health Department.
You can imagine my face when I heard this news. “Of course they use us! They just don’t KNOW they use us! Who do they think is inspecting their food, and keeping their air smoke-free?!?!”. Incredulous, I dug into the data with an obsession bordering on unhealthy.
I made a plan--it was time to change the conversation.
When we define success with one singular metric--a satisfaction score, a case rate, a crime rate--we limit our understanding of the complexities of success.
We needed to frame the concept of a “thriving community” holistically. We needed to ask better questions to measure what mattered. Through a whole lot of cajoling, we convinced our friends in City Hall to let us replace our satisfaction questions with questions that truly reflected what we were trying to change. We wanted to measure social bonds, a sense of community, and the prevalence of isolation.
Borrowing from other Social Capital assessments, we used our space on the survey wisely. We asked how often folks had friends of a different race over to their house. We asked how they would rate their own health. And, my favorite, we asked them if they were better off than their parents were at their age.
One of the reasons I love working for mySidewalk is the opportunity to help communities establish measures of success that are engaging, creative, and mission-aligned. Among our 3500 indicators of a thriving community are some true gems that often represent deeper issues that we might expect.
Inspired by the work of our partners, I present to you my 9 favorite indicators of a thriving community available in the mySidewalk data library.
#9. The Particulate Matter Environmental Justice Index
Source: Environmental Protection Agency
The air we breathe and the water we drink is a cornerstone of a strong community. Straight-up particulate matter data isn’t enough, especially out of context. This index takes into account the disproportionate impact of poor air quality on low-income neighborhoods and communities of color, groups already at a higher risk of poor health outcomes, and reduced economic opportunity.
#8. Chronically Absent Students
Source: U.S. Dept. of Education: Civil Rights Data Collection
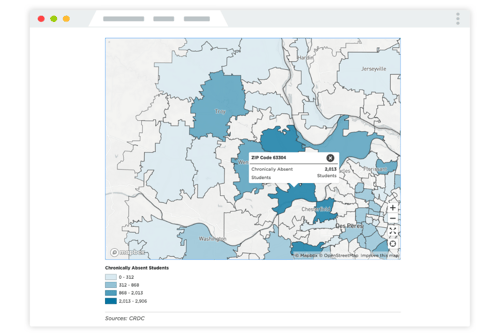
The School to Prison pipeline is real and it matters. Educational inequity leads to later life struggles and chronic absenteeism points to something bigger going on: transit, child care for younger siblings, and health care access.
#7. Commuting to work alone
Source: Census Bureau: 2014-2018 American Community Survey 5-Year Estimates
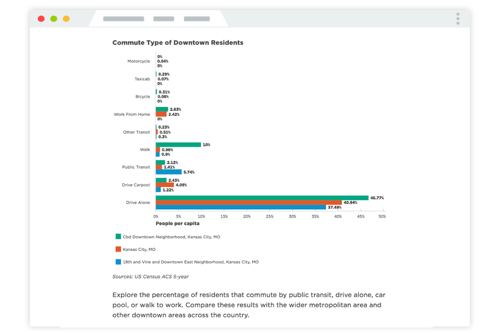
There is nothing we love more at mySidewalk than a proxy variable. This indicator serves as a proxy for social isolation. If you aren’t lucky enough to be able to ask the questions we did on our Res Sat survey, this is a good backup plan.
#6. No SNAP, Under Poverty
Source: Census Bureau: 2014-2018 American Community Survey 5-Year Estimates
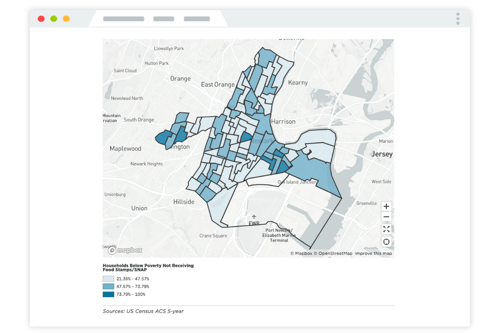
If everyone who is eligible for a benefit isn’t taking it up, are you reaching those in need? We need to understand not only whether your residents know about benefits, but whether there are social stigmas clouding their desire to use the benefits they are entitled to or whether infrastructure (hello Grocery Stores on transit lines!) is conducive to benefit use.
#5. Mentally Unhealthy Days
Source: Centers for Disease Control and Prevention: 500 Cities Project
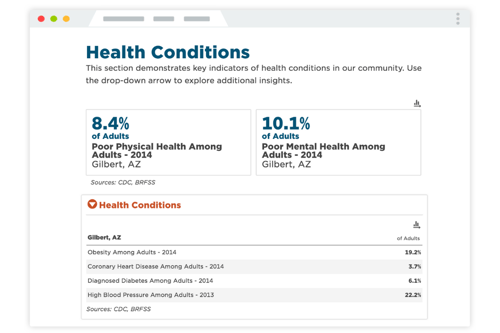
Although only available at the census tract level for 498 cities, the CDC 500 Cities Data is a gold mine. Resilient communities rely on resilient humans, and often behavioral health takes a back seat to physical health in public dialogue. Elevating the importance of mental health is the right thing to do.
#4. The Percent of Income Spent on Housing + Transportation for Low-Income Households
Source: Department of Housing & Urban Development (HUD); Department of Transportation
Just looking at the mean or median income ignores the differential impact of living costs on the most marginalized. This indicator is one of our most used. The poorest in your community are often forced to spend more than they make on housing and transportation. Ask yourself: how are they making ends meet and what implications does this have for community stability?
#3. Mortgage Denial Rates by Race
Source: Federal Financial Institutions Examination Council (FFIEC): Home Mortgage Disclosure Act
Another proxy! We know that inequities we see today are built on a legacy of structural discrimination. Specifically, FHA loans which (ostensibly) should have similar denial rates across race since it is an income-contingent loan program show that there is still some deep-seated opportunity gaps for generating wealth. This indicator is one of our most popular conversation starters.
#2. People in poverty working full time
Source: Census Bureau: 2014-2018 American Community Survey 5-Year Estimates
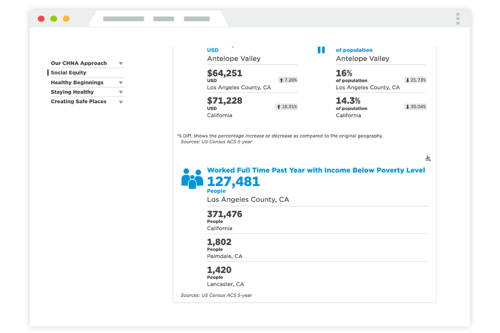
The American Dream--work hard and you will inevitably succeed--isn’t a reality for all. A large percent of many of our residents are working over 40 hours a week and are still struggling to make ends meet.
#1. Life Expectancy
Source: Centers for Disease Control and Prevention: National Center for Health Statistics
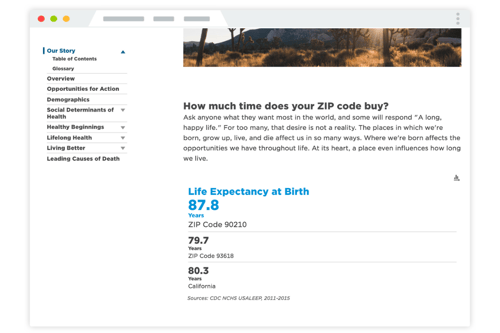
Is there anything more important than how long we live? Yep. How long we live and how long our neighbors down the road live -- the difference between the two -- is a powerful measure of community wellbeing.
National events like a presidential election make us re-examine issues in our communities and remind us of a strangely comforting truth: It doesn't matter who's in the White House -- your city and community's definition of success is in your hands. Take control of changing the conversation. Our legacy of public service will be defined in the history books by how we confronted the reality of our inequities. Did we turn a blind eye to the 15-year difference in a matter of city blocks? Or did we take the challenge head-on and make bold choices to close that gap? I have faith it will be the latter.
What’s your favorite indicator in the library?
Shout it out! Hit us up at @mysidewalkHQ on Twitter.
Share this
You May Also Like
These Related Stories
Democratizing Data through Accessibility

No Comments Yet
Let us know what you think