During a pandemic, the needs of your community increase. As a public health leader, you need the right data so you can respond effectively. You need information that helps you provide transparency and address the factors that impact the health of your community. mySidewalk's goal is to empower you with the intel you need, so you can help the people who need it most.
This quick video explains how public health leaders can use mySidewalk's new report templates to lift up important policy issues by connecting social and economic drivers with health outcomes.
The report templates provide social and economic data tailored to a COVID-19 world, tools you can use to support your community health plans.
COVID-19 Reports for SDoH
mySidewalk has been building tools to help public servants respond to the impacts of COVID-19. In the four-minute video below, our VP of Health Solutions, Dr. Sarah Martin, shows a quick overview of mySidewalk's new Digital Inclusion & Equity Report and Unemployment Impact Report. These reports highlight different kinds of disparities and how the pandemic is impacting them.

Digital Inclusion & Equity Report
Digital equity doesn't just mean access to computers or the internet. It’s about having access to knowledge. It's about democracy – a crucial health determinant.
mySidewalk's new Digital Inclusion Report template is powerful because it allows you to clearly see inequities in knowledge access across your zip codes and counties.
In the video above, you can see what the visualization for Los Angeles looks like. The map shows that 15% of households in LA do not have access to the internet. It's also clear that there are evident correlations between that disparity and factors like income and race.
This report is especially timely because it emphasizes the issue of social equity. It also highlights which school districts will have a more difficult time moving to long-term distance learning.
Unemployment Impact Report

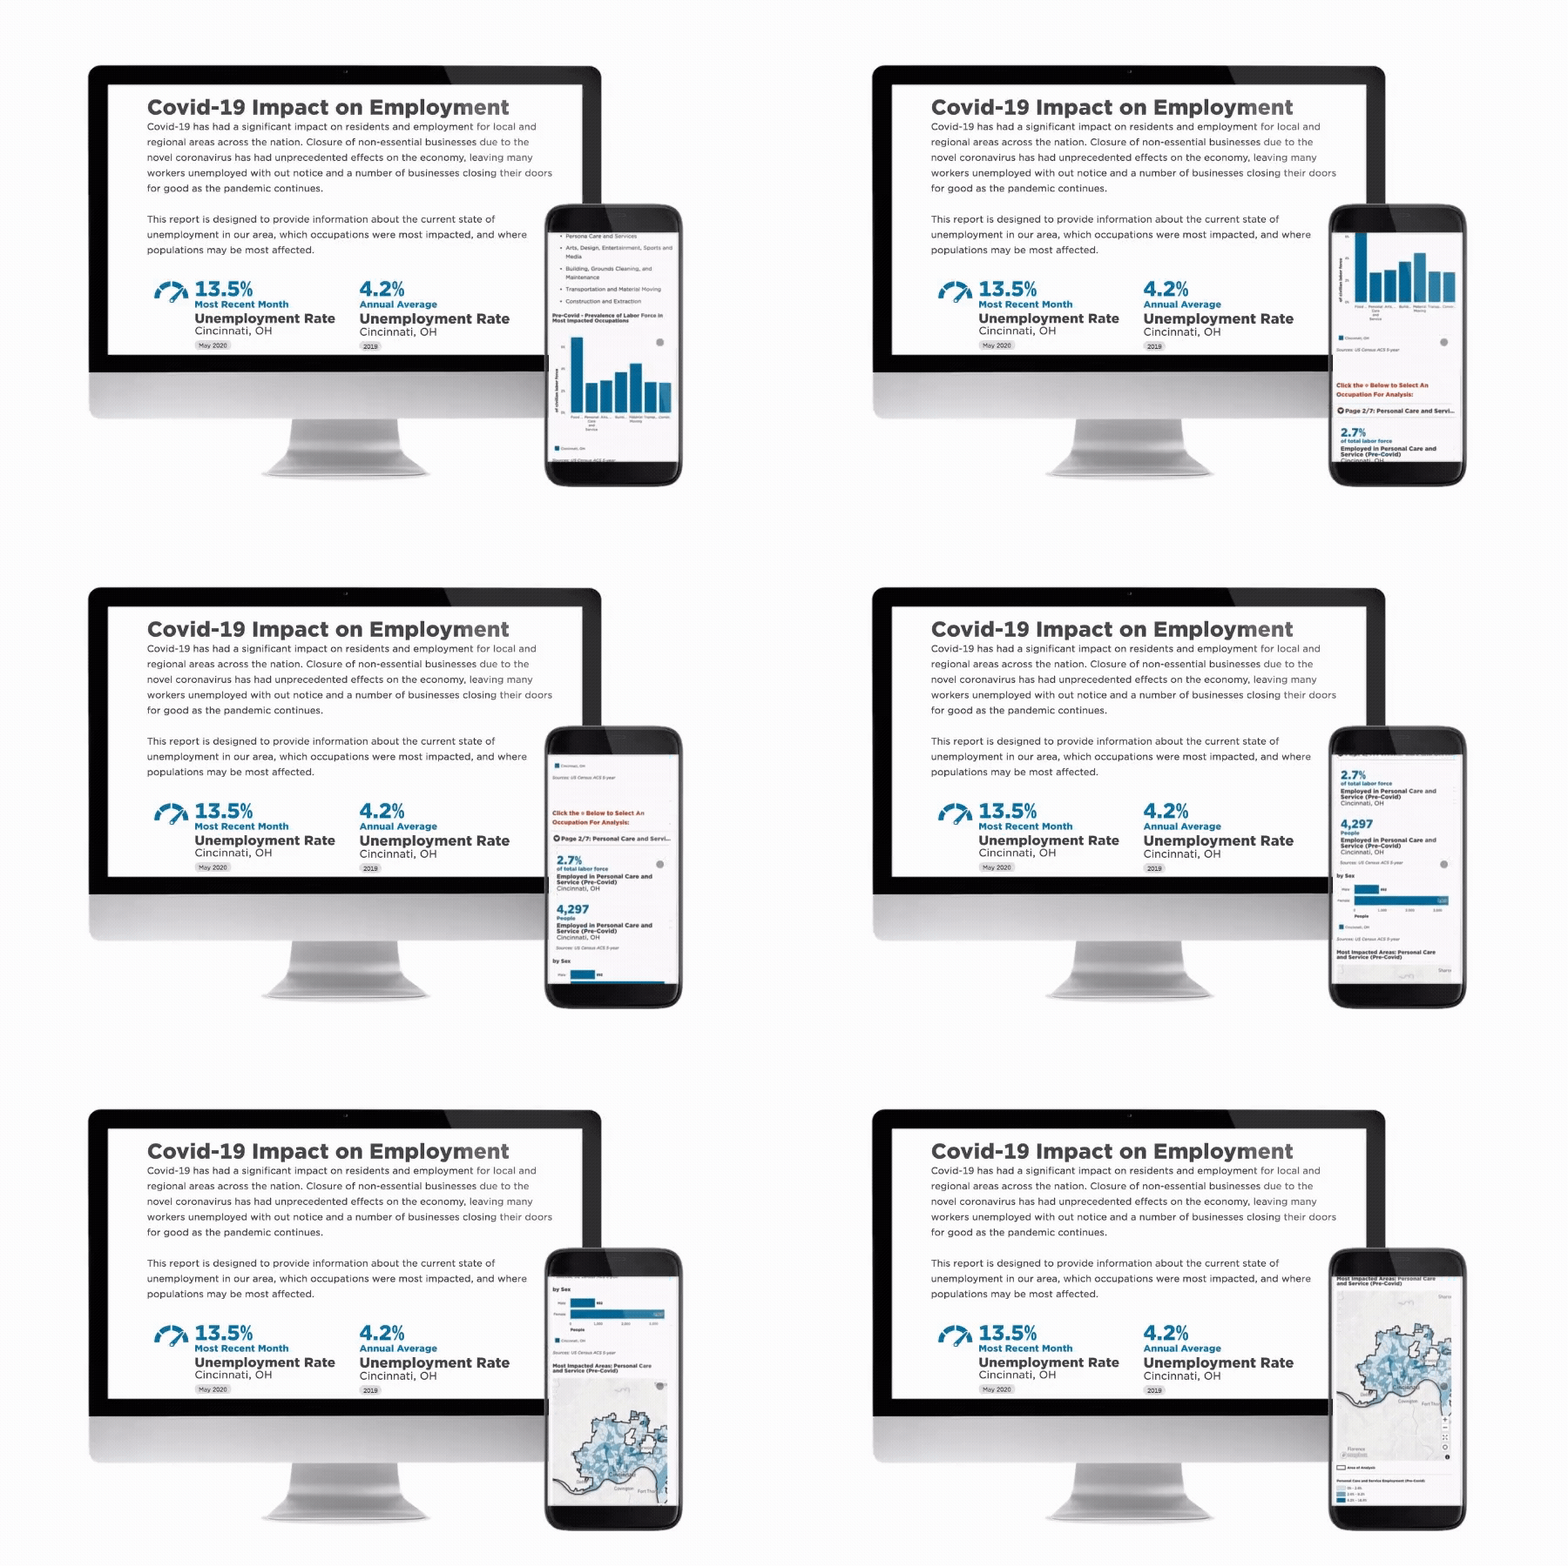
Our new Unemployment Report is useful because it gives a granular breakdown of unemployment by month. A data point that is especially relevant during COVID-19, when more jobs are at risk.
We built it because our customers wanted to see what the rate of unemployment has been, and which industries have been most affected.
The report shows you the six occupational groupings most impacted by COVID-19, including service-related occupations that require close in-person contact.
- Food Preparation and Serving
- Personal Care and Services
- Arts, Design, Entertainment, Sports, and Media
- Building, Grounds Cleaning, and Maintenance
- Transportation and Material Moving
- Construction and Extraction
This report is also helpful because it allows you to track your community's unemployment rate against other cities and counties. It enables you to see how your unemployment rate compares, and to collaborate with peer communities on how they're addressing this challenge.
Both of these new mySidewalk reports are extremely easy to create. You simply set your custom geography.
We hope these templates make your job a little bit easier. Thank you for all that you do as a public health leader.
If you're new to mySidewalk, you can learn more about our health solutions here, or request a demo. If you're currently a mySidewalk customer, these reports are now available. If you have any questions, please reach out to your account manager or email us at hello@mysidewalk.com.
No Comments Yet
Let us know what you think